Demographics is destiny. — Arthur Kemp
The political destiny of the U.S. for the next 25 years is sealed.
Here’s how:
In the United States, the proportion of the population aged >65 years is projected to increase from 12.4% in 2000 to 19.6% in 2030 (3). The number of persons aged >65 years is expected to increase from approximately 35 million in 2000 to an estimated 71 million in 2030 (3), and the number of persons aged >80 years is expected to increase from 9.3 million in 2000 to 19.5 million in 2030 (3). In 1995, the most populous states had the largest number of older persons; nine states (California, Florida, Illinois, Michigan, New Jersey, New York, Ohio, Pennsylvania, and Texas) each had more than one million persons aged >65 years (4). In 1995, four states had >15% of their population aged >65 years; Florida had the largest proportion (19%) (5). By 2025, the proportion of Florida’s population aged >65 years is projected to be 26% (5) and >15% in 48 states (all but Alaska and California) (5).
(source: CDC http://www.cdc.gov/mmwr/preview/mmwrhtml/mm5206a2.htm )
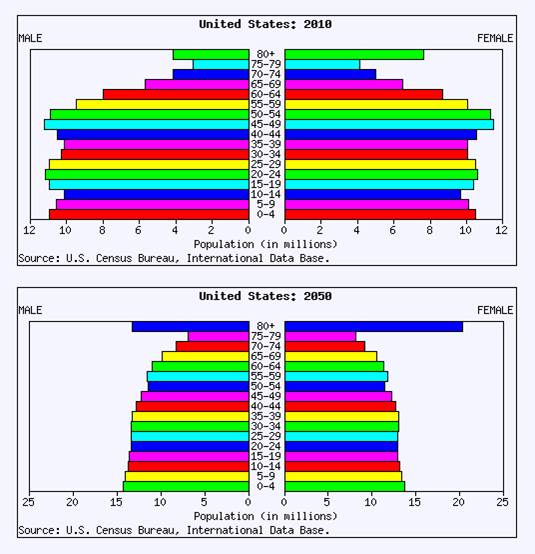
Here’s how it looks graphically in one of those demographic pyramid charts I’m always ranting about. (Note that the axis scale changes; what’s important is the shape)
(click image for larger size)
(source: US Census Bureau)
The disaster of Japan’s demographics:
(click image for larger size)
Sources: Japan Statistics Bureau, Japan MIC, Japan Ministry of Health, Labour and Welfare
Note the inverting demographic pyramid as Japan moves through time. The point is that there are not enough young workers to pay for the social cost of the aging, non-working population, especially health care. Northern and western Europe and Russia exhibit similar demographic pyramids.
The only reason the U.S. chart doesn’t look like Japan’s is immigration. Immigration is the only chance to have enough young workers to pay for the older population. If you strip out the immigrant population in the U.S., the demographic pyramid looks a lot more like Japan’s.
So, what’s the point of this as it relates to politics?
Older people tend to vote more conservatively.
Sources:
http://www.gallup.com/poll/106042/age-vote-more-strongly-related-obamamccain-matchup.aspx
http://elections.nytimes.com/2008/results/president/national-exit-polls.html
Older people tend to vote for older people.
Source: http://onlinelibrary.wiley.com/doi/10.1111/j.1559-1816.1987.tb00318.x/abstract
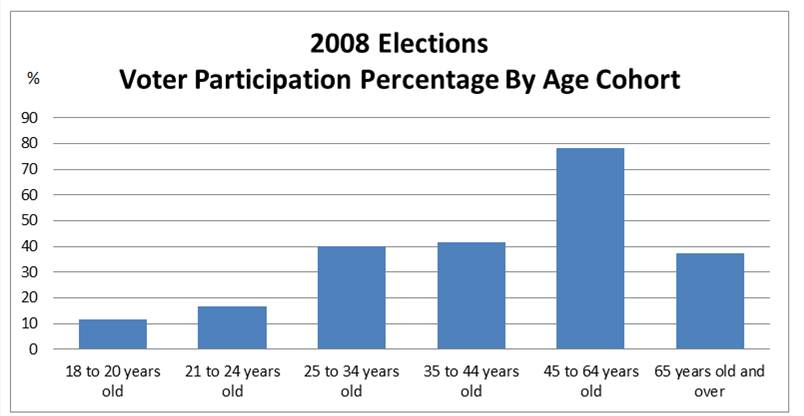
Older people vote more than young people.
(click image for larger size)
Source: U.S. Census Bureau http://www.census.gov/compendia/statab/cats/elections/voting-age_population_and_voter_participation.html
Older people watch more television.
Sources:
http://www.variety.com/article/VR1117988273
http://www.huffingtonpost.com/2010/08/16/broadcast-tv-audience-agi_n_683009.html
Older viewers watch conservative news.
Sources:
http://www.pensitoreview.com/2009/05/05/average-age-of-fox-news-viewer-is-65/
http://www.hollywoodreporter.com/blogs/live-feed/fox-news-oldest-cable-audience-54230
Older people are the fastest growing segment of internet users and blog more than younger age cohorts.
Sources:
http://www.pewinternet.org/Infographics/2010/Internet-acess-by-age-group-over-time.aspx
http://pewresearch.org/pubs/1093/generations-online
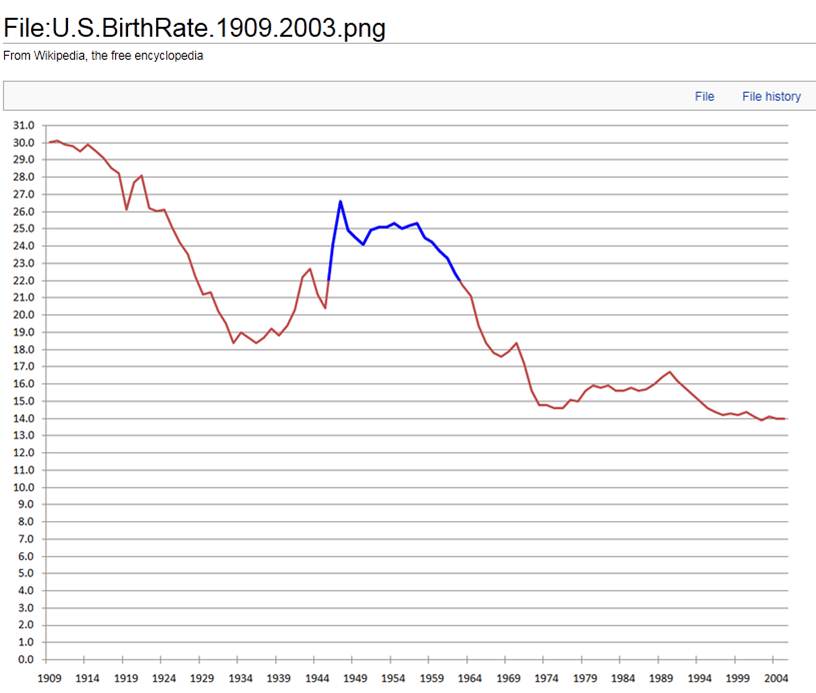
There are 76 million baby boomers coming down the demographic pipe, 24.4% of the 2011 population.
Source: U.S. Census bureau
(click image for larger size)
Chart source: CDC
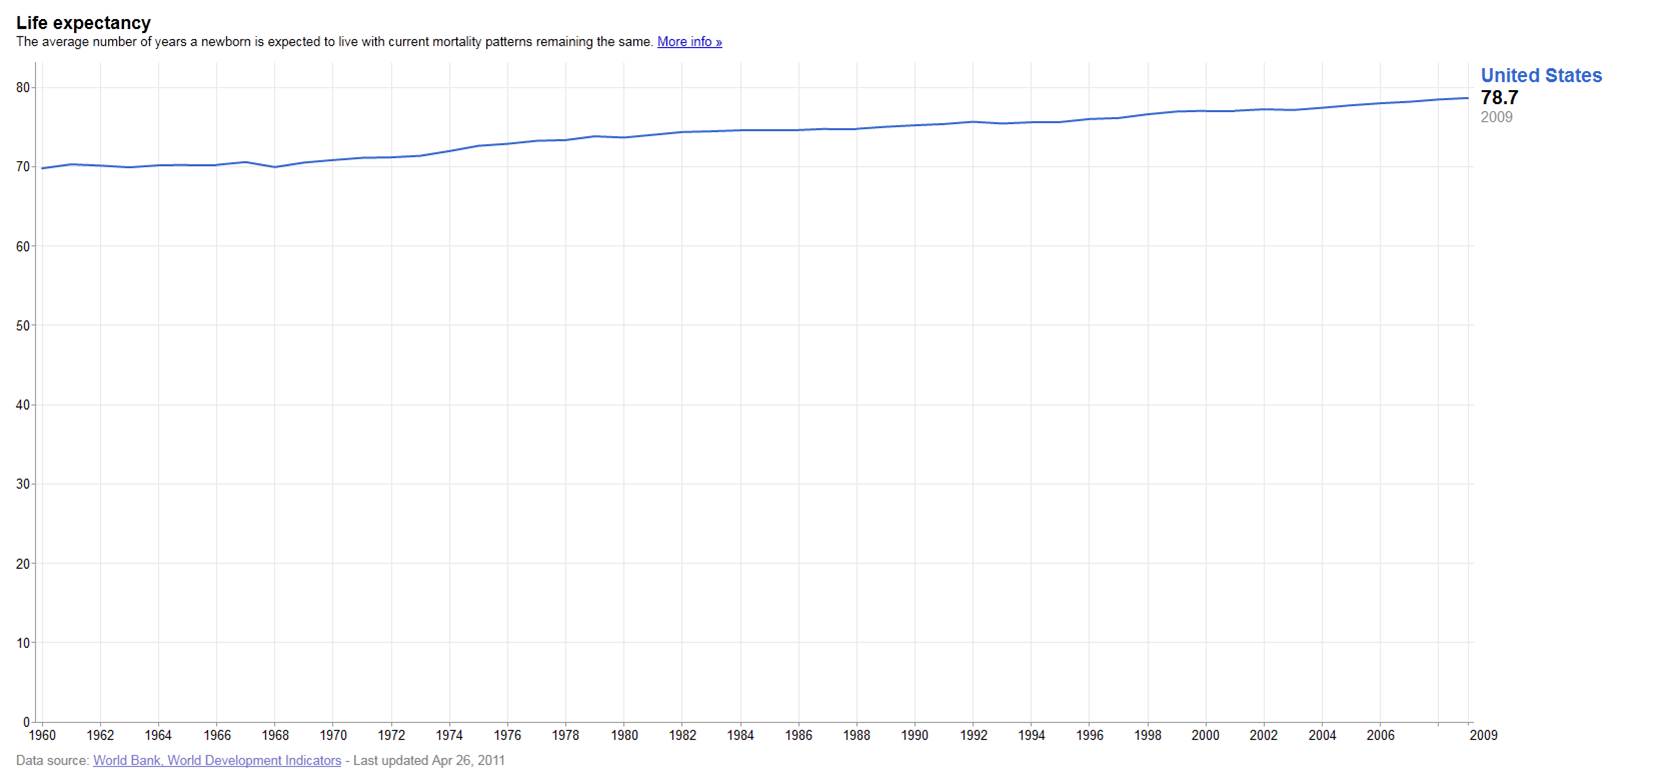
People in the U.S. are living longer.
(click image for larger size)
Source: World Bank
The boomers will be around for a long time: 1955 + 80 = 2035.
Source: elementary math
Political Implications:
As the rat of the boomers moves down the demographic snake and the U.S. population ages out, the U.S. will go through an extended period of conservative voting driven by an increasingly aging population that has little more to do than sit in front of the television and the internet.
In parallel to the aging out of the boomers and their increasing political conservatism and intellectual isolation and decline, the U.S. will go through an extended period of political, social and cultural crisis of confidence and identity as the rest of the world catches up economically and collectively threatens and attenuates the multi-faceted global dominance the boomers’ world view took for granted.
If geopolitics remain comparatively stable, the U.S. will remain relatively center-right politically when compared to OECD peers, as they also trend toward conservative politics driven by their own similar demographic shifts and perceived geopolitical and domestic threats.
Due to the demographics, there will be an opportunity for a radical shift in the U.S. to a far-right, ultra-nationalist political movement if a significant and extended crisis threatens “life as we’ve always known and remember it” in the U.S. Examples of disruption that could trigger such a move include: energy, food, climate, large-scale regional war, world war, financial collapse, etc.
Conclusion:
It is difficult to imagine any demographic or geopolitical scenario conducive to a sustained left/liberal political agenda in the U.S. for the next 25 years.


Nailed it!