A PDF file version of this post is available here: http://www.hackneys.com/docs/healthcarereformfaq.pdf
===================================================================
Q: Why should I care about health care system reform in the United States?
A: Because:
-
The nation can no longer afford the current system, not on an individual, family, business, state or national level. Left unchecked, health care system spending will reach 20% of GDP by 2017.
-
Health care system reform in the United States will affect health care worldwide, to the extend it attenuates innovation in new forms of diagnosis and treatment.
-
The quality, cost and outcomes of health care in the United States is sub-standard when compared to peer economies, yet Americans pay more for health care than any other country on earth.
-
More than 47 million Americans are without health insurance; when they seek care it is extremely costly when delivered via Emergency Rooms and other high cost delivery settings.
-
More than 10% of American children are without health insurance.
===================================================================
Q: The current system is excellent, the best in the world. Why should we change?
A:There are some stakeholders who are very resistant to change of any form, and use the rationale that the U.S. health care system is peerless and inherently above reform. Those of us who’ve been around the various aspects of the system for decades and have seen the ugly stuff hidden under the rugs tend to feel differently. But for those who believe there is nothing wrong with the standards of care and outcomes the current system delivers, it is worth taking a look at data from uniform comparative surveys with peer economies and data from within the U.S. itself.
Total Health Expenditures Per Capita, U.S. and Selected Countries, 2006
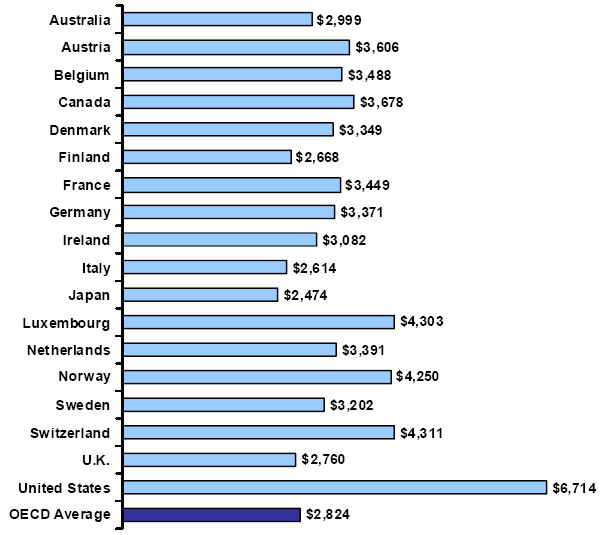
Amounts in U.S.D. Source: Organisation for Economic Co-operation and Development, OECD Health Data 2008, updated August 26, 2008.
How Do Assessments of U.S. Patients Compare to Assessments of Patients in Other Countries?
The Commonwealth Fund ( http://www.commonwealthfund.org/ ) regularly surveys the experiences of patient in several countries. The 2008 survey focused on patients who had at least one chronic condition (arthritis, cancer, depression, diabetes, heart disease, hypertension, lung problems) and was conducted in eight countries (Australia, Canada, France, Germany, the Netherlands, New Zealand, the United Kingdom, and the United States). Figure 9 provides highlights of the findings. [B]Because the questions focus on problems, a higher score represents poorer performance.[/B] Patients with chronic illnesses in the United States report more problems than patients in any of the other seven countries with access problems related to cost and with having received wasteful care. These same patients report the best experiences among the countries surveyed with waiting times to see a specialist. In most other categories, U.S. performance is in the middle.
Source: RAND, Schoen C, Osborn R, How SKH, Doty MM, Peugh J, “In Chronic Condition: Experiences of Patients with Complex Health Care Needs, In Eight Countries, 2008,” Health Affairs [Epub, November 13, 2008], Vol. 28, No. 1, 2009, pp. w1—w16.
Note that counties with universal access, overtly capitated systems rated poorly on access (time to treatment). The U.S. rated poorly on cost and receiving wasteful care. If you read the OP you know the cost story. Wasteful care is a clinical inefficiency often exemplified by needless tests and diagnostic imaging usually driven by the need for the doctors, staff and hospital to protect themselves from litigation. A series of studies conducted over the past two decades indicate that [I]one-third or more of all procedures performed in the United States are of questionable benefit[/I]. (See, for example, Bernstein et al., 1993; Hilborne et al., 1993; Kleinman et al., 1994; Winslow et al., 1988.)
So, with same-set data the U.S. scores better in access and poorer in cost and waste, neither of which should be a big surprise.
How about the performance measured within the U.S. itself? How well is the health care system performing to its own metrics?
Percentage of Recommended Care Received by U.S. Adults
In a recent study that produced the first national report on quality of care, RAND assessed the extent to which recommended care was provided to a representative sample of the U.S. population for a broad range of conditions in 12 metropolitan areas. Key findings include the following:
- Overall, adults received about half of recommended care.
- Quality of care was similar in all of the metropolitan areas studied.
- Quality varied across conditions, and across communities for the same condition.
- No community had consistently the best or worst quality of care.
- All sociodemographic groups were at risk for poor care.
SOURCES: RAND, Author’s analysis of (a) S. M. Asch, E. A. Kerr, J. Keesey, J. L. Adams, C. M. Setodji, S. Malik, and E. A. McGlynn, “Who Is at Greatest Risk for Receiving Poor-Quality Health Care?” New England Journal of Medicine, Vol. 354, No. 11, 2006, pp. 1147-1156 and (b) E. A. McGlynn, S. M. Asch, J. Adams, J. Keesey, J. Hicks, A. DeCristofaro, and E. A. Kerr, “The Quality of Health Care Delivered to Adults in the United States,” New England Journal of Medicine, Vol. 348, No. 26, 2003, pp. 2635-2645.
Note that last bullet point: Care is consistently sub-standard across all sociodemographic groups.
Reliability of Care for Population Subcategories: Sex, Age, Race, Education, and Income
Source: RAND, Asch et al., 2006.
What do these last two charts mean? They mean that between 40 and 50% of the time the people of the United States do not receive the the care recommended for them.
And for this we pay more money than any other society on the planet earth for health care.
The United States is a hero based culture. We are exceptionally excellent at diving in and saving lives using extraordinary courage, fortitude and beyond-science-fiction-level technology.
However, once you get beyond the ‘hero’ aspects, our health care system delivers sub-standard results at a beyond-premium price.
As a country, we are not receiving value for our money.
We need health care system reform not only because we’re going broke paying for the current system, we need it because our health care system does not deliver what we are paying it to do – produce positive outcomes.
===================================================================
Q: How is the money for health care spent?
A: There are four primary sources of money spent on health care in the United States:
- Medicare: public money spent on health care for the elderly
- Medicaid: public money spent on health care for the poor
- Private insurance: private money spent on health care by company and worker funded health insurance
- Out of pocket: private money spent on health care by company and worker funded co-payments and deductibles
In 2006, the total amount spent on health care in the U.S. was allocated as follows:
Health Care Spending, 2006
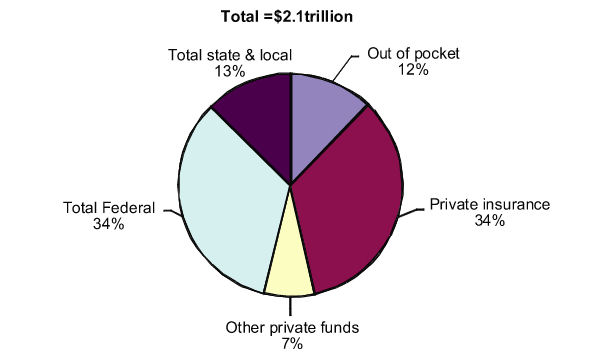
SOURCE: RAND, Centers for Medicare & Medicaid Services, Health and Human Services, “National Health Expenditures Accounts, 1965–2017 (Personal Health Care).”
This chart shows more detail on the public monies spent on health care:
Details of Public Sources of Health Care Spending, 2006
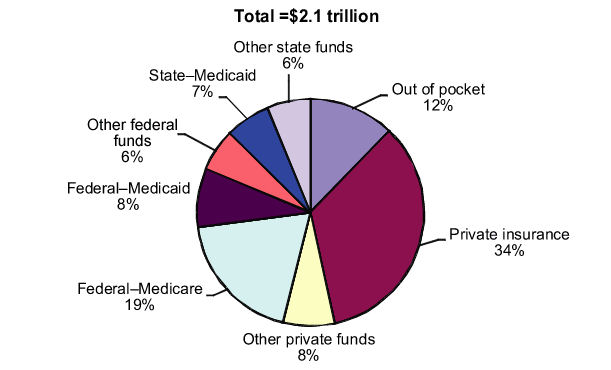
SOURCE: RAND, Centers for Medicare & Medicaid Services, Health and Human Services, “National Health Expenditures Accounts, 1965–2017 (Personal Health Care).”
Sources of Payments for Health Care, 1965–2017 (historical and projected)
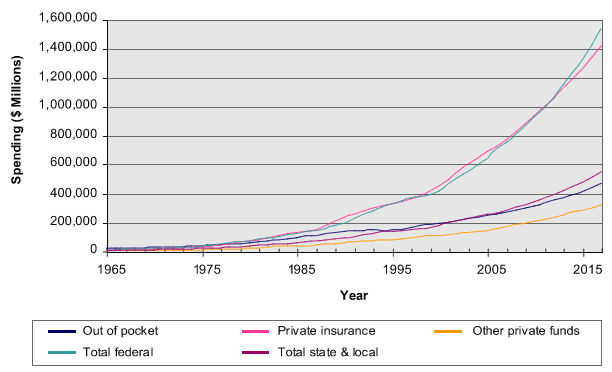
SOURCE: RAND, Centers for Medicare & Medicaid Services, Health and Human Services, “National Health Expenditures Accounts, 1965–2017.”
- In 1965, out-of-pocket expenses made up 44% of health spending, private insurance made up 24 percent, and federal outlays constituted 11%.
- By 1980, out-of-pocket expenses decreased sharply to only 23% of health spending, while the proportion of federal health spending increased to 28%.
- In 2000, the proportion of out-of-pocket spending had fallen to 14% of total health spending, and federal outlays made up 31% of heath spending.
- Currently, the proportions of health care spending are even more weighted toward federal spending and private insurance (33% and 35%, respectively); out-of-pocket expenses are now equivalent to state and local contributions (12%).
Total federal spending has grown, on average, about 12% per year, about twice as fast as out-of-pocket expenses, which are growing at an annual rate of about 6.5%. Private insurance grows at about 10% per year; and state and local spending grows at about 9%.
Personal Health Care Expenditures
Personal health care expenditures consist of the total amount of money spent to treat individuals with specific medical conditions.
Personal Health Care Expenditures, by Type of Expenditure, 2006
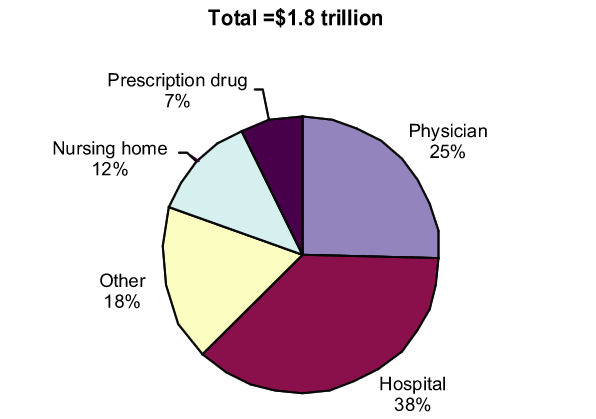
SOURCE: Centers for Medicare & Medicaid Services, Health and Human Services, “National Health Expenditures Accounts 1965-2017.”*
*NOTE: Physician category comprises physician and clinical services; hospital category comprises hospital care, other category comprises other personal health, dental services, other professional care, structures and equipment, and home health care.
===================================================================
Q: Doesn’t our current system work best for the very poor or the very wealthy? Isn’t everyone else in the middle left out?
A:The average household spends around 6% of their personal income on health care. There are major variations across the age and economic spectrums.
- The elderly and individuals in low-income households devote a much larger share of their income to medical expenses than other groups.
- Low-income households spend nearly 16% of their income on health care; higher-income households spend 3 to 5 percent.
- Households headed by individuals age 65 and older spend more than 11% of their income on health care.
- Households headed by younger persons spend just under 3 percent.
Household Health Spending as a Percentage of Personal Income in the United States, 1987-2003
SOURCE: RAND, Centers for Medicare & Medicaid Services (CMS), Office of the Actuary: Data from National Health Statistics Group, 1987-2003; U.S. Department of Commerce, Bureau of Economic Analysis (BEA) (January, 2005) as cited in Cowan CA. “Ultimate Source of Funding in the United States, 1987-2003,” Presentation (National Health Statistics Group, Office of the Actuary, CMS, September 30, 2005). Last accessed on November 11, 2008: [url]http://www.oecd.org/dataoecd/42/3/35823168.ppt[/url]
Health Care Spending as a % of Income, by Age, 2006*
Source: RAND, U.S. Department of Labor (DOL), U.S. Bureau of Labor Statistics (BLS), Table 3: Age of Reference Person: Average Annual Expenditures and Characteristics, Consumer Expenditure Survey, 2006. Last accessed on November 12, 2008: [url]http://www.bls.gov/cex/2006/Standard/age.pdf[/url]
*Regardless of insurance status.
Health Care Spending as a Percentage of Income by Income Level, 2006*
Source: RAND, U.S. Department of Labor (DOL), U.S. Bureau of Labor Statistics (BLS), Table 2, Income Before Taxes: Average Annual Expenditures and Characteristics, Consumer Expenditure Survey, 2006. Last accessed on November 12 2008: [url]http://www.bls.gov/cex/2006/Standard/income.pdf[/url]
*Regardless of insurance status.
===================================================================
Q: Isn’t Universal Access the same thing as nationalized health care? Doesn’t Universal Access mean we are socializing medicine? Doesn’t Universal Access mean we are becoming a socialist/communist country?
A: No.
This a common misperception. Universal Access is not a nationalized health care system.
Universal access does not equal nationalized health care. In the current debate on health care reform, a single payer nationalized health care system is not even on the list of options. In the U.S., it is politically non-viable, a complete non-starter.
Nationalize: Verb -ized, -iz·ing, -iz·es ‘nashunu`lIz
– Put under state control or ownership
(Source: WordWeb Pro, answers.com)
Universal Access: Stipulation that every participant in health care has the right according to law to purchase health insurance from a private insurance entity. The participant’s purchase is voluntary and must not be eligible for a public health insurance program. (Source: Insurance Dictionary)
Please note the phrase: purchase health insurance from a private insurance entity
There is no nationalization in universal access.
Universal access is not nationalized health care.
The health care system that you and your family, along with every other American, will end up with at the end of this debate will almost certainly retain all the components and industries you are currently familiar with. The vested interests involved have way too much political influence for them to be removed from this cash stream.
Universal access means that every citizen has access to health care. In the U.S., that will mean that every citizen will have some form of health insurance.
Nationalized health care is a single payer system in which there is one set of data standards, one set of payment standards, one set of everything related to the basic health care system. In some systems, such as the UK, a nationalized system is combined with 3rd party/private insurance. Compared to the thousands of payers a typical hospital has to deal with in the U.S., a single payer system might seem pretty efficient and a tremendous potential cost saver, but it will not happen in the U.S. anytime within our political lifetimes, so you don’t have to lose any sleep over that one.
If you want to have nationalized care or see how it works, you’ll need to move to or visit Canada, the UK, etc.
The closest thing to nationalization among any of the policy proposals on the table for the U.S. is to allow open access to the Federal Employees Health Benefits Program (FEHBP).
The Federal Employees Health Benefits Program (FEHBP) is the largest employer-sponsored health insurance program in the country, with approximately eight million enrollees located around the country, and is often touted as a model for “managed competition” in the health insurance marketplace. The FEHBP is the health insurance program offered to federal employees (including members of Congress), their families, and retirees. (Federal retirees over the age of 65 generally have Medicare as their primary coverage, with FEHBP as a secondary insurance.)
The U.S. Office of Personnel Management (OPM) manages the FEHBP. OPM is in charge of approving and monitoring health plans, negotiating benefits, and determining premium rates. Individual federal agencies process enrollments and collect premiums. Federal agencies send collected premiums to OPM, where they are deposited in a trust fund. The trust fund then pays premiums to the participating health plans and transfers administrative fees to OPM. In addition, a reserve of money is held in the trust fund that can be used to blunt changes in premiums from year to year or to cover losses for a particular health plan.
This option would allow people who are not federal employees, their dependents, or retirees to participate in the FEHBP.
In this policy option, [B]the same private insurance companies that provide coverage today would be providing this coverage tomorrow[/B]. All the Feds do is provide a pool / group to the insurance companies to underwrite.
Italicized source: RAND
===================================================================
Q: My rates are affordable and we receive good health care. I don’t see a problem. Why should we change a system that works for me?
A: As I wrote in the essay Thoughts on Health Care Reform: “There are two basic pools of people and correlated perspectives on health care in the U.S. The sample groups are bifurcated between those who have access to health care at low to moderate cost (those insured on affordable plans that provide reasonable access to care), and those who are not in that group, such as the self-employed and the uninsured. It is essentially impossible for those who have access to affordable health care to understand the nature and scope of the challenge in a direct and personal way, unless someone they know well or a close family member is in the group without access to affordable healthcare.”
The yawning chasm between those with affordable group based health care and the rest of the population is not limited to understanding and perception of a problem, it is also manifested financially. Even for those who have private insurance coverage, the proportion of income spent on health care can be significant.
Blumberg and colleagues (2007) measured the level of health care spending, including premium payments and out of pocket (OOP) spending, among individuals and families with private health insurance coverage. They determined that, even among households with insurance, the proportion of income spent on health care can be significant, particularly in lower income groups (see Table 1).
Table 1. Health Care Spending as a Proportion of Income Among Households with Private (Non-group or Employer-Sponsored) Insurance Coverage, 2001—2003
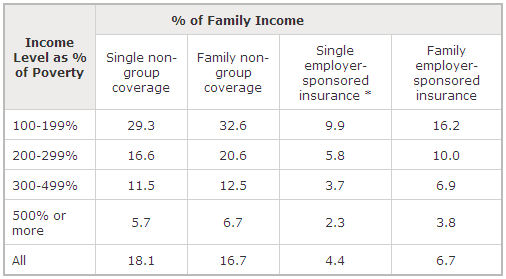
SOURCE: RAND, Adapted from a table in Blumberg LJ, Holahan J, Hadley J, Nordahl K, “Setting a Standard of Affordability for Health Insurance Coverage,” Health Affairs, Web Exclusives, [Epub, June 4, 2007], Vol. 26, No. 4, July/August 2007, pp. w463—w473.
*Excluding the cost of forgone wages.
As you will notice, there is a significant difference in health insurance costs between those with group and non-group coverage.
For those without affordable group coverage, the cost of health care insurance is often a financial crisis.
Again, quoting from the Thoughts on Health Care Reform essay, “Iowa consumers found that in order to cope with rising health insurance costs, 86 percent said they had cut back on how much they could save, and 44 percent said that they have cut back on food and heating expenses. Retiring elderly couples will need $250,000 in savings just to pay for the most basic medical coverage. A new survey shows that more than 25 percent said that housing problems resulted from medical debt, including the inability to make rent or mortgage payments and the development of bad credit ratings. About 1.5 million families lose their homes to foreclosure every year due to unaffordable medical costs.”
Between 2003 and 2006 health insurance premiums increased by 42%, while rates of increase in inflation and earnings fluctuated between 2% and 6%.
Illustrations of Health Insurance Premium Increases
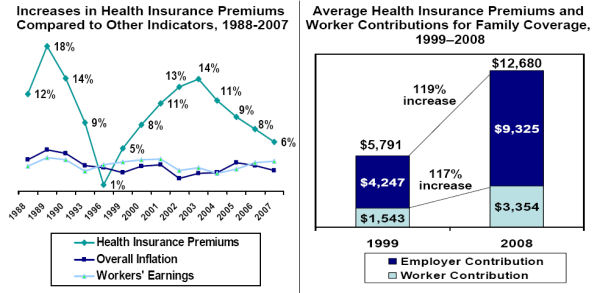
Source: Kaiser/HRET Survey of Employer-Sponsored Health Benefits, 1999-2008; KPMG Survey of Employer-Sponsored Health Benefits, 1993, 1996; The Health Insurance Association of America (HIAA), 1988, 1989, 1990; Bureau of Labor Statistics, Consumer Price Index, U.S. City Average of Annual Inflation, 1988-2007; Bureau of Labor Statistics, Seasonally Adjusted Data from the Current Employment Statistics Survey, 1988-2007.
===================================================================
Q: The number of people without insurance, 47 million, is a bogus number. The census bureau says there are 37 million people at or below the poverty line and every one of them is eligible for Medicare. The other 10 million all choose not to have insurance. Why do we need to change if these people are either eligible or willingly not choosing to have insurance?
A: Federal law does not require states to cover adults under Medicaid, unless they are disabled, elderly, or pregnant — regardless of income. Many states cover adults as an optional population, though coverage is very limited. Twenty-seven states have eligibility levels for non-working adults with incomes below the poverty level and 26 states have eligibility levels less than the poverty level for working adults. All states except Alaska and Connecticut have eligibility levels for disabled optional populations of less than the poverty level. Thus in most states, Medicaid coverage is limited to very low-income Americans. Medicaid is a vital source of coverage for low-income Americans, but existing state Medicaid programs have not reached everyone living below the poverty level.
Medicaid and State Children’s Health Insurance Program (SCHIP) are public health insurance programs that provide health benefits to certain low-income groups. Medicaid is a federally regulated, state administered, jointly funded health insurance program for low-income families and individuals who meet certain eligibility requirements under federal and state law. Although the federal government provides general guidelines regarding which individuals must be covered under Medicaid, states set their own guidelines regarding eligibility, for determining income and resources, and for deciding the breadth of services covered. Eligible individuals typically fall under three types of groups: categorically needy, medically needy, or special groups. States may extend eligibility, under the medically needy option, to include additional individuals who may have incomes too high to qualify under mandatory or optional categorically needy groups.
Poor and near poor adults and children are the most likely to lack health insurance. More than a third of adults with incomes below 100 percent of the federal poverty level (FPL) and nearly a third of adults with incomes less than 200 percent of the FPL are uninsured, compared with 18.1 percent of those with incomes between 200 and 300 percent of the FPL, 10.7 percent of those with incomes between 300 and 400 percent of the FPL, and 5.4 percent of those with incomes equal to or greater than 400 percent of the FPL (Hoffman, Schwartz, and Tolbert, 2007).
Figure 9 presents the uninsured rate by household income. The high cost of health insurance means that lower income groups are more likely to be uninsured. Households with incomes of less than $25,000 are nearly three times as likely to be uninsured the entire year as are households with incomes of $75,000 or more.
Figure 9. Uninsured Rate, by Household Income
SOURCE: RAND, Adapted from DeNavas–Walt, Proctor, Smith, 2007, Table 6.
NOTE: The uninsured category represents people who were uninsured during all of the relevant calendar year.
Figure 10 shows the relationship between income, as reflected in multiples of the federal poverty level, and type of coverage. Public insurance programs (such as Medicaid) help make up some of the difference in coverage among income groups, but not enough to bring the poor up to the same levels of coverage as higher income groups.
Figure 10. Health Insurance Coverage, by % of Federal Poverty Level (FPL), 2007
Note the portion of each income segment that is uninsured. Not everyone qualifies for Medicaid or other public health programs, no matter what their income level.
Most Americans with no health insurance do not choose to be uninsured, unless the definition of choose means choosing between buying shelter (mortgage, rent, etc.) and food or paying for health insurance.
QuickStats: Reasons for No Health Insurance Coverage* Among Uninsured Persons Aged <65 Years — National Health Interview Survey, United States, 2004†
* Based on response to a survey question regarding the reasons a household member stopped being covered by health insurance or did not have health insurance. Persons might be counted in more than one category.
† Estimates are age adjusted using the 2000 projected U.S. population as the standard population and using four age groups: 0–11 years, 12–17 years, 18–44 years, and 45–64 years. Estimates are based on household interviews of a sample of the civilian, noninstitutionalized U.S. population.
§ 95% confidence interval.
¶ Includes moved, self-employed, never had coverage, did not want or need coverage, and other unspecified reasons.
Overall, approximately 17% (41 million) of persons aged <65 years had no health insurance at the time of interview. Of these, approximately one half did not have coverage because of cost, and one fourth did not have coverage because of loss of a job or a change in employment. Approximately 14% of uninsured persons did not have coverage because their employer did not offer it or the insurance company refused coverage, and 10% did not have coverage because of cessation of Medicaid benefits. Less than 3% of persons without health insurance did not have coverage because of a change in marital status or death of a parent.
SOURCE: CDC, Adams PF, Barnes PM. Summary health statistics for the U.S. population: National Health Inteview Survey, 2004. National Center for Health Statistics. Vital Health Stat 2006;10(229). Available at http://www.cdc.gov/nchs/data/series/sr_10/sr10_229.pdf . Henry J. Kaiser Family Foundation, “Medicaid’s Optional Population: Coverage and Benefits,” The Kaiser Family Foundation, (2005),Italicized source: RAND
===================================================================
Q: The numbers of people without insurance are not true. They are counting people that are without insurance for a brief time between jobs. Why should we change based on bogus numbers?
A:The numer of people without health insurance is actually calculated based on people who have been without health insurance for an entire year.
In 2007, about 45.7 million individuals in the United States were uninsured. They come from every income level, age group, employment status, gender, race, ethnicity, and region of the country.
During the course of a calendar year (the time frame used to describe insurance status in many surveys), individuals may gain or lose coverage. Data from the 2006 Medical Expenditure Panel Survey (a set of large scale surveys of families and individuals, their medical providers, and employers across the United States) present a dynamic picture of insurance status in the United States. In that year, 68 million non–elderly individuals were uninsured at some point during the year [23% of the 2006 U.S. population]; 50.1 million were uninsured throughout the first half of the year; 37.1 million were uninsured all year (Chu, Rhoades, 2008). The substantially larger proportion of Americans who lacked insurance for some part of that year reflects a level of potential financial risk as the result of a medical emergency that is not reflected in “all year” uninsured statistics.
Number Uninsured and the Uninsured Rate, 1987 Through 2006
NOTE: The uninsured category represents people who were uninsured during all of the relevant calendar year.
Italicized source: RAND
===================================================================
Q: The uninsured are all illegal immigrants or lazy bums who won’t get off their butts and get a job so they can get insurance. Why should we change our system for them?
A: In 2007, about 45.7 million individuals in the United States were uninsured. They come from every income level, age group, employment status, gender, race, ethnicity, and region of the country. Some groups are more likely than others to be uninsured, but because of their lower numbers in the general population, they do not necessarily make up the largest shares of the uninsured population. For example, Hispanics are more likely to be uninsured than non–Hispanic whites, but there are more non–Hispanic whites that are uninsured.
In general, (younger) adults, males, immigrants, the poor, American Indians/Alaska natives, Hispanics, and individuals living in the South and West are most likely to be uninsured. Nevertheless, (because of underlying differences in the larger population) most of the uninsured are workers, are white, are citizens, and are over 30.
During the course of a calendar year (the time frame used to describe insurance status in many surveys), individuals may gain or lose coverage. Data from the 2006 Medical Expenditure Panel Survey (a set of large scale surveys of families and individuals, their medical providers, and employers across the United States) present a dynamic picture of insurance status in the United States. In that year, 68 million non–elderly individuals were uninsured at some point during the year; 50.1 million were uninsured throughout the first half of the year; 37.1 million were uninsured all year (Chu, Rhoades, 2008). The substantially larger proportion of Americans who lacked insurance for some part of that year reflects a level of potential financial risk as the result of a medical emergency that is not reflected in “all year” uninsured statistics. Were a catastrophe to strike at the wrong time, such as during a transition from job to job or some other life event, those individuals and families would be vulnerable.
Family work status, family income, and age. Figure 7 shows the family work status, family income, and age of the uninsured. Uninsured individuals are likely to be employed, young adults, poor or near poor, and childless. Adult men are more likely to be uninsured than adult women: Medicaid provides coverage to some pregnant women and single mothers.
Family work status, family income, and age. Figure 7 shows the family work status, family income, and age of the uninsured. Uninsured individuals are likely to be employed, young adults, poor or near poor, and childless. Adult men are more likely to be uninsured than adult women: Medicaid provides coverage to some pregnant women and single mothers.
Characteristics of the Uninsured 2007
SOURCE: RAND, The Uninsured: A Primer (#7451–04), The Henry J. Kaiser Family Foundation, October 2008. As of November 28 2008 available at: http://www.kff.org/uninsured/7451.cfm. This information was reprinted with permission from the Henry J. Kaiser Family Foundation. The Kaiser Family Foundation is a nonprofit private operating foundation, based in Menlo Park, California, dedicated to producing and communicating the best possible information, research, and analysis on health issues. NOTE: The federal poverty level(FPL) was $21,203 for a family of four in 2007.
Note that 69% of the uninsured were full time workers and 12% were part time workers. This means that 81% of the uninsured in America were working in 2007.
Race, ethnicity and place of birth. Figure 8 shows type of insurance coverage by race and ethnicity:
- About one–third of Hispanics and American Indians are uninsured, compared with 12% of non–Hispanic whites and 18% of Asians.
- Of uninsured persons, 78% are native or naturalized U.S. citizens.
- Although recent immigrants are less likely to be insured, evidence suggests that they are not the primary cause for growth in the uninsured population (Holahan, Cook, 2005).
Insurance Status, by Race/Ethnicity
SOURCE: RAND, The Uninsured: A Primer (#7451–04), The Henry J. Kaiser Family Foundation, October 2008. As of November 28 2008 available at: http://www.kff.org/uninsured/7451.cfm. This information was reprinted with permission from the Henry J. Kaiser Family Foundation. The Kaiser Family Foundation is a nonprofit private operating foundation, based in Menlo Park, California, dedicated to producing and communicating the best possible information, research, and analysis on health issues. NOTE: The uninsured category represents people who were uninsured during all of the relevant calendar year.
Italicized source: RAND
===================================================================
Q: Most proposals I see for a new system include a mandate for everyone to have health insurance. Why should everyone be required to be insured?
A:A national health care system, boiled down to its essense, is basically a demogrphics numbers game, just like social security. If the young and healthy, who typically have very low health care costs, are not in the overall pool of insured, then the pool will skew toward the old, unhealthy and high cost members of society.
The only way a system based on private insurance, which is what we have and will continue to have in the U.S., can be affordable, is to have everybody in the pool so that from and actuarial standpoint, it can be affordable. Put another way, if the only people in the pool are unhealthy and high cost, then the cost for the system will be very expensive. The country cannot afford a very expensive system any longer. By getting everyone into the pool, the overall risk and costs are much, much lower, thus the cost of insuring everyone on a per individual basis is lower.
===================================================================
Q: I am hearing talk that the system used to ensure federal employees will be opened up to all Americans. What does that mean?
A:The Federal Employees Health Benefits Program (FEHBP) is the largest employer-sponsored health insurance program in the country, with approximately eight million enrollees located around the country, and is often touted as a model for “managed competition” in the health insurance marketplace. The FEHBP is the health insurance program offered to federal employees (including members of Congress), their families, and retirees. (Federal retirees over the age of 65 generally have Medicare as their primary coverage, with FEHBP as a secondary insurance.)
The U.S. Office of Personnel Management (OPM) manages the FEHBP. OPM is in charge of approving and monitoring health plans, negotiating benefits, and determining premium rates. Individual federal agencies process enrollments and collect premiums. Federal agencies send collected premiums to OPM, where they are deposited in a trust fund. The trust fund then pays premiums to the participating health plans and transfers administrative fees to OPM. In addition, a reserve of money is held in the trust fund that can be used to blunt changes in premiums from year to year or to cover losses for a particular health plan.
This option would allow people who are not federal employees, their dependents, or retirees to participate in the FEHBP.
In this policy option, the same private insurance companies that provide coverage today would be providing this coverage tomorrow. All the Feds do is provide a pool / group to the insurance companies to underwrite.
Opening up the FEHBP is viewed as a relatively easy option for health care reform.
In my view, it is easy for the following reasons:
- It requires no structural change in the existing system. All current components function exactly like they always have. It really is nothing more than a ‘front-end’ for the existing private insurance companies, in other words, all it does is create a new pool of applicants for the insurance companies to analyze, price and sell product to.
- It has no political price. The managers of the program cannot and do not fund a PAC, so there is no potential loss of revenue for a legislator. The managers of the program have no political voice or clout. The downside is there is no PAC, other than the insurance companies, around to distribute funds to promote this legislation. Even so, it is a win-win for a legislator: no one of any power to make angry and no potential loss of lobbying dollars.
- In the context of the health care system, it is easy to implement. It is nothing more than creating a new pool and selling that pool to an existing set of suppliers.
- It is possible to protect the existing pool from the new entrants. By creating a new pool of non-fed employee applicants, people like you can be insulated from the pricing of the new applicants. In other words, by isolating the non-fed insured in seperate pool, fed employees do not have to suffer higher premiums to cover new applicants with poor health and high costs.
- It is a natural program for guaranteed acceptance. Because it is a fed program, it is relatively (politically) easy to make this the supplier of last resort for any uninsured. By guaranteeing acceptance, regardless of pre-existing condition, it ensures that every person can find insurance. As you suggest, federal subsidies can be used to ensure affordability in light of this potentially high-cost loaded pool.
- It is a natural adjunct to a mandatory-insurance scenario. In a private insurance based system such as we have and will continue to have, it is essential to get everyone into the insurance pool. If the young and healthy do not get into the pool, the pool will be skewed to the older and unhealthy. Boiled down to its essence, public health is a demographic numbers game, just like social security. Be mandating that everyone in the country must be insured, the public health pool of insured is quickly and effectively moved into a much lower cost realm, from the actuarial standpoint. By using the FEHBP as a guaranteed-acceptance, insurer of last resort, along with subsidies to the private insurance companies who cover the high cost pool, individual tax credits for lower income customers, tax offsets and deductions for higher income customers, etc., for funding, there is no excuse for anyone to not be insured (other than the iconoclast curmudgeons among us).
For these reasons and more, I think it is likely that the FEHBP will be a component of the new system.
Italicized Source: RAND
===================================================================
Q: I read/listen to/watch to my favorite blog/station and they say that health care reform is communism/a plot of the neocon fascists. Why should I support health care reform?
A: Media personalities, especially polarizing media personalities, have only one agenda and that is to expand and strengthen their notariety and franchise. They are excellent at accomplishing that goal at any cost, including well structured public policy for the United States. You can always count on media personalities to spew a hot stream of assertions and opinions, but you cannot count on them for facts.
The debate about the reform of the U.S. health care system will probably be one of, if not the, most important public policy debates of our lifetime. It will determine the course of health care for us, for our children and for our grandchildren. What is put in place will be in place for decades.
I believe it is very important for Americans to be educated about the facts regarding the current health care system and the proposals for new public policy related to health care.
I believe that citizens who are armed with the facts can make their own informed decisions about what system they feel is best for the country and then participate in the debate to shape future public policy.
Assertions and opinions such as those provided by media personalities and their acolytes, true believers and foot soldiers are rightfully protected by law and custom. However, at this time, what the country needs most is facts and data on which to base these critical decisions regarding public policy.
Facts and/or data are a positive contribution. Strongly held opinions in the absence of factual or data support do not contribute to the debate.
What is needed now is not bombastic proclamations. What is needed now is education of the American people about the facts and the supporting data around our current and proposed health care system in the U.S.
I believe now is the time to put aside philosophical and partisan political rancor and put together a health care system that the country can afford and provides parity outcomes with other industrialized countries.
The country needs everybody to be part of this process–you, me, and everybody we know. IMO, if we leave this to the special interests and the vested interests of the existing system we will not produce a system that is in our best interests.
Health care reform is going to happen in some form. It can either happen with us or without us. I think our chances as a society for success are greater if it happens with all of us armed with facts and supporting data.
The media personalities really don’t care what happens as long as they remain media personalities. Those of us who need a functioning, productive and high quality health care system do care what happens. We can only make it happen with facts, not opinions.
===================================================================
Q: Aren’t most health care issues a result of poor personal choices? Why should I pay more for someone ele’s bad life choices?
A: Your question goes to the heart of why public policy is very, very challenging. It’s relatively easy to get people to agree that change is necessary compared to gaining consensus on what the change ought to be. The question you ask is but one of the very, very tough questions related to health care systems that must be resolved; especially as those tough questions relate to the rationing of the available throughput and capabilities of the health care system.
We met a man on our travels who survived two seperate heart bypass operations and still smoked like a chimney and drank like a fish. Should he get an angioplasty or another bypass if he rolls into an ER on a gurney in full cardiac arrest?
These are the questions that the congressional staffers and lobbyists who actually write the policy and laws we live under are probably discussing right now as I write this.
Here’s some information from RAND, a major supplier of the data and analysis to the people who form public policy in America. In fact, those capital hill staffers and lobbyists who are writing the law for the potential next health care system probably just came from a briefing by a RAND team.
Major Influences on Health
Health policy changes may not affect health as much as expected because medical care is only one factor determining the health of an individual or population. Medical advances have improved care and outcomes for many diseases, but the effects of health care on health may be less than the effects of other factors (Evans, Barer, Marmor, 1994).
Factors that strongly affect health include the following:
- Behavioral choices: Diet, exercise, smoking, and sexual practices, among other behaviors, influence health.
- Genetics: Chronic illnesses, such as diabetes and cardiovascular disease, have a genetic component.
- Social circumstances: Education, employment, income, race/ethnicity, and poverty are several of the social factors that influence health.
- Medical care: Both access to and quality of care are factors. Medical care is generally assumed to improve health; however, medical errors can actually be a significant source of mortality and morbidity.
- Environmental conditions: Physical surroundings, including pollutants, food contamination, and microbial agents, all affect health.
One way to assess the importance of these factors is to quantify how each affects the number of premature deaths in the United States. Figure 1 illustrates this link.
Causes of Premature Death in the United States, 2002
SOURCE: RAND, Created with data from McGinnis JM, Williams-Russo P, Knickman JR, 2002.
The interaction among these categories is clearly significant. For example, poor diet combined with a genetic predisposition for heart disease may have a greater effect on health than just the sum of these two risk factors. Thus, even if a proposed policy would improve the quality of or access to health care, it may have a limited ability to extend life or reduce morbidity (the relative incidence of a particular disease).
Obesity increases the prevalence of chronic disease and can lead to significant disability, decreasing health related quality of life (Lakdawalla, Bhattacharya, Goldman, 2004). Rates of obesity related disability increase as people get older, as illustrated in Figure 11.
Figure 11. Rate of Routine Needs Disability per 10,000 U.S. Population, by Age Group and Obesity Status, 1990
SOURCE: RAND, Lakdawalla, Bhattacharya, Goldman, 2004.
One study predicts that if the obesity trends continue without any other changes in behavior or medical technology, the proportion of people reporting fair or poor health would increase by about 12 % among men and 14 % among women by the year 2020 (Sturm, Ringel, Andreyeva, 2004).
Obviously, lifestyle choices make a significant difference in an individual’s overall health and the subsequent societal costs of health care.
From the health care reform standpoint, lifestyle choices that lead to chronic disease states are a very undesireable and expensive outcome. To mitigate and minimize these outcomes, it is likely that the proposed Disease Management component will be included in any new health care system.
Disease management (DM) is an organized, proactive approach to health care for members of a population with a specific disease or combination of diseases or to prevent the development of diseases. The aim of DM is to increase the delivery of appropriate care to enrolled patients. Improved care is expected to lead to better health outcomes and lower costs. Although the original impetus for DM was quality improvement, the focus in recent years has been on its potential to reduce spending. Cost reduction would be achieved through fewer acute exacerbations of disease, leading to lower utilization of avoidable inpatient and emergency care services. Savings would be achieved if utilization of avoidable services outweighed the cost of delivering the DM services and any increase in utilization of appropriate services. Since patients with chronic diseases account for a large share of total health spending, the potential savings through better management of chronic diseases are large.
Almost all DM programs identify a target population, such as patients with a particular diagnosis, patients who are at risk for developing a chronic condition, or employees eligible for a wellness intervention. Patient participation is voluntary. The programs identify a set of (usually measurable) goals, such as decreasing hospitalizations among participants, improving compliance with medications, or increasing exercise levels. Some organizations, particularly health plans, administer their own DM programs, but many organizations contract with third-party vendors to administer the plan. The level of involvement of physicians in DM plans differs. For example, physicians and support personnel in health maintenance organizations may be integrally involved in the DM care processes. Physicians in a community setting could conceivably have patients in their practice who have the same diagnosis but who have different insurers and therefore may be enrolled in different commercial DM programs. These plans operate with less physician involvement. Some DM plans include financial incentives to the DM organization for meeting care management and/or cost goals.
Italicized Source: RAND
===================================================================
Q: There is a lot of talk about the need to fully computerize patient records, hospital records, etc. I don’t want my health care history computerized because I think digital health care information will be used by insurance companies to deny coverage and employers to deny employment.
A:As I mentioned in the Comments On Health Care Reform essay, Americans have a morbid fear of a unique medical ID due to privacy fears. As dieselcruiserhead notes, there are many others who fear an Electronic Medical Record (EMR) due to privacy concerns.
In this case, I am the grim reaper; “I am become death , the destroyer of worlds;” the ultimate messenger of bad news. It doesn’t matter if your medical records are paper or digital, the data is already collated and available. Resisting the Electronic Medical Record (EMR) will not prevent everything about your medical history from being known. It already is.
And if you think that is disconcerting, as jacket pointed out, the health care market segment is a decade or two behind all other industry segments. Other industry segments such as travel, banking, telecommunications, insurance, retail, etc.
Americans have a knee-jerk reaction about privacy and information but have essentially zero awareness that every single aspect of their existence is already known, cross-referenced and merchandised.
Does that mean that health care system information should not be digital?
Although this will border on an opinion, I believe that a review of the information technology (IT), medical and ethicists research and discussions on this topic will yield a result that the societal advantages of a fully digital health care system far outweigh the risks.
At the individual level, the ability to be fully portable across an entire nation’s health care system for your medical condition, past treatments, current treatment methodology and prescription drug mix would be more than just life saving, it would probably be the highest impact major thing we could do to add efficiencies and lower costs to the nation’s health care system. At the macro level, the ability to analyze the effeciency and outcomes of various treatments, drugs, protocols, etc., across the incidence footprint of various disease states would be staggeringly powerful for improving outcomes and reducing costs. (Yes, that comment can be interpreted as a full-on drool from someone who used to design and build systems to accomplish that goal.)
That’s the good news. The bad news is that it will take a looooooot longer and billions more in costs to accomplish this goal than any politician realizes or will ever talk about if they did.
Believe me, I’ve personally lived this, and it is very, very challenging. Be wary of anyone who promises a return on investment (ROI) in a near-term time frame.
However, that should not change the primacy of the health information technology (HIT) option in the debate, or its role in a probable new health care system. It is almost certain that HIT will be included, if for no other reason than executives, including politicians, love magic bullets, and HIT is often viewed as such.
The U.S. health care system has been called the world’s largest, most inefficient information enterprise. Most health information is still stored on paper in individual physician offices and health care organizations. The use of information technology (IT) in the health care system trails far behind other sectors of the economy, and the United States trails far behind other countries in rates of use of health IT. Health IT refers to a variety of electronic tools for use in the management of health information. Applications of health IT include the electronic medical record (EMR), the electronic health record (EHR), the personal health record (PHR), computerized physician order entry (CPOE), clinical decision support (CDS), picture archiving and communications systems, (PACS) and e-prescribing. In addition, health information exchanges (HIEs) are being developed to support sharing of information electronically among health care providers. Health IT is an enabling technology that may allow other cost containment strategies to be implemented (for example, better claims transaction processes, more-efficient management of patients within systems, reducing unnecessary utilization through more clinically detailed criteria for matching patients to interventions). Policy options focus on approaches to accelerating adoption of health IT, including financial incentives, direct provision, regulatory mandates, development of standards, and enhancing the interoperability of health IT through the establishment of health information exchanges at the local, regional, and national levels.
Proponents believe that widespread adoption and use of such health IT applications will lead to substantial improvements in health care delivery, leading to improved quality, better health, and lower costs. However, much of the promise associated with health IT requires high levels of adoption (90 percent of doctors offices, hospitals, and other clinical settings) and high levels of use of interoperable systems (in which information can be exchanged across unrelated systems) that are used to change clinical workflow (for example, improved management of chronic disease).
Italicized Source: RAND
===================================================================
Pingback: Autopsis » Blog Archive » Health Care Reform, the Napkin Version